1. TSSs supported by 14 studies
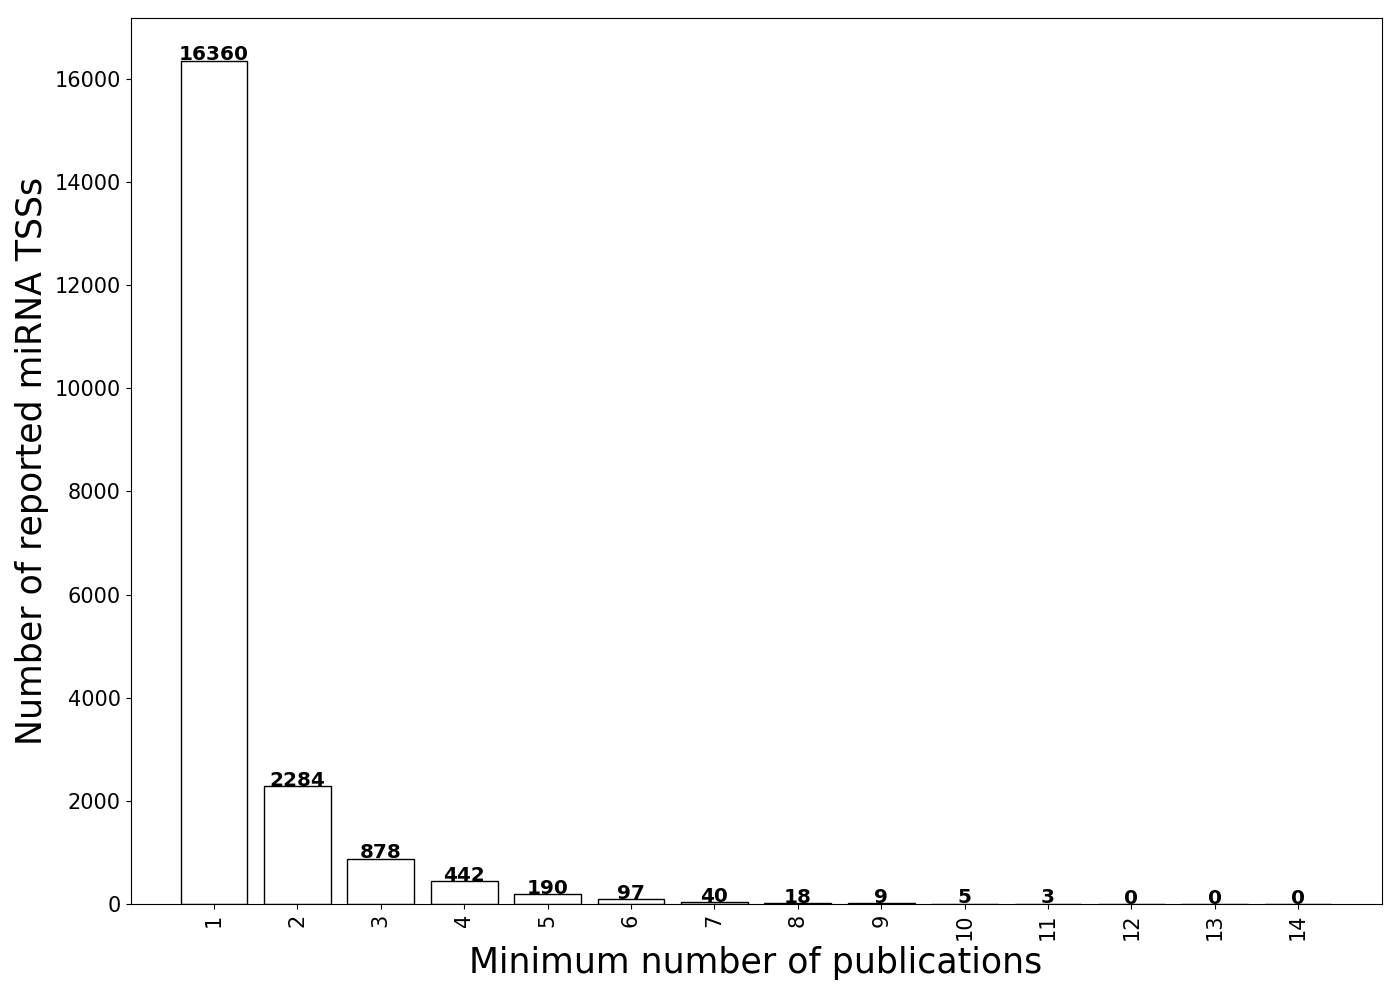
Number of TSSs supported by different number of publications.
2. Robustness of RSmiRT
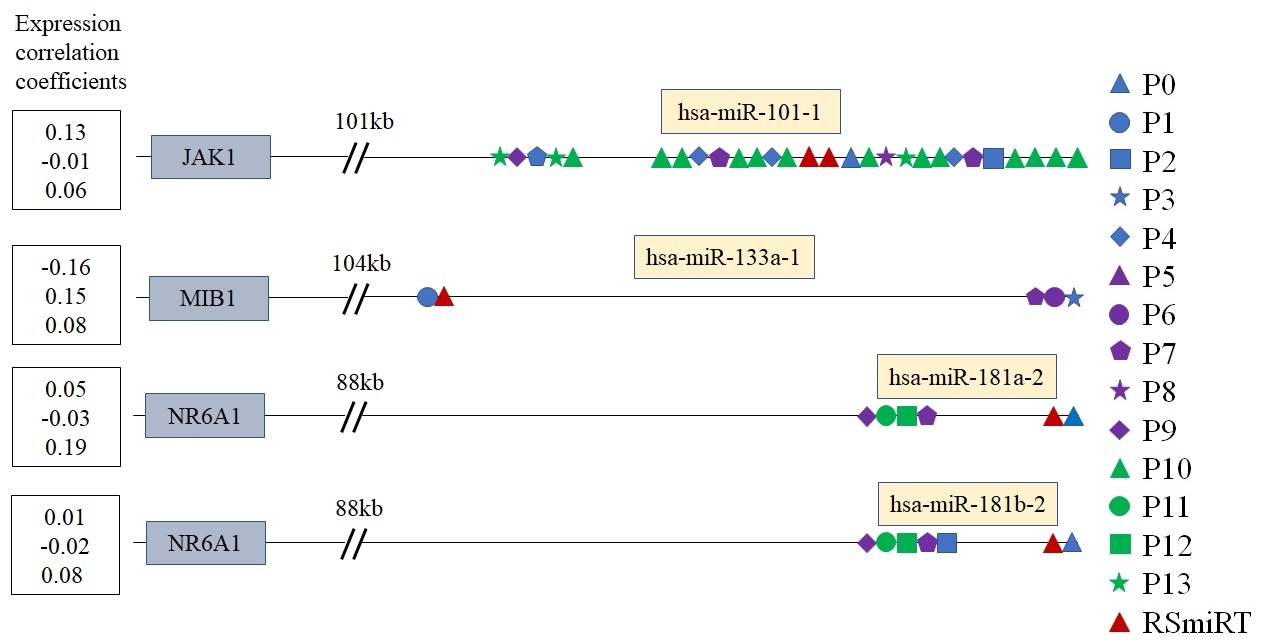
In order to find the robustness of this dataset, we compared this dataset with two sets miRNA TSSs from data of the 14 studies, weighted by two metrics separately. The first metric was the publication year of corresponding study and the other metric was the number of miRbase miRNAs reported by corresponding study (Table 1 in manuscript). In case of the first scoring metric, we assigned the each of 14 studies a score in the range of 0.7 to 1.0 according the oldest publication year (P1 and P5) to the most recent publication year (P10 and P12). When using the second metric, we scored each of 14 studies a score in [0.7, 1.0] based on the number of miRNAs they reported. Then for each cluster generated in the way described above, we calculated the sum of the scores for the TSSs in that cluster supported by different studies. The scoring system with the first metric, assigned the old and unreliable miRNA TSS dataset less weights than the most recent dataset. The second scoring metric put more importance on the dataset supporting a larger number of miRNAs. Finally, the miRNAs having at least one cluster with at least 4.0 score were kept for both scoring metrics, which left us 172 and 170 filtered miRNAs respectively. At the end, we compared the RSmiRT dataset with these two sets of miRNAs. We found all of the miRNAs in the two sets already included in the RSmiRT dataset. This confirms the robustness of RSmiRT TSSs on the given dataset.3. Correlation between expressed miRNA and host gene transcripts
We also investigated the expression correlation between intragenic miRNAs and their host gene transcripts using two correlation datasets.
3.1 Correlation dataset 1
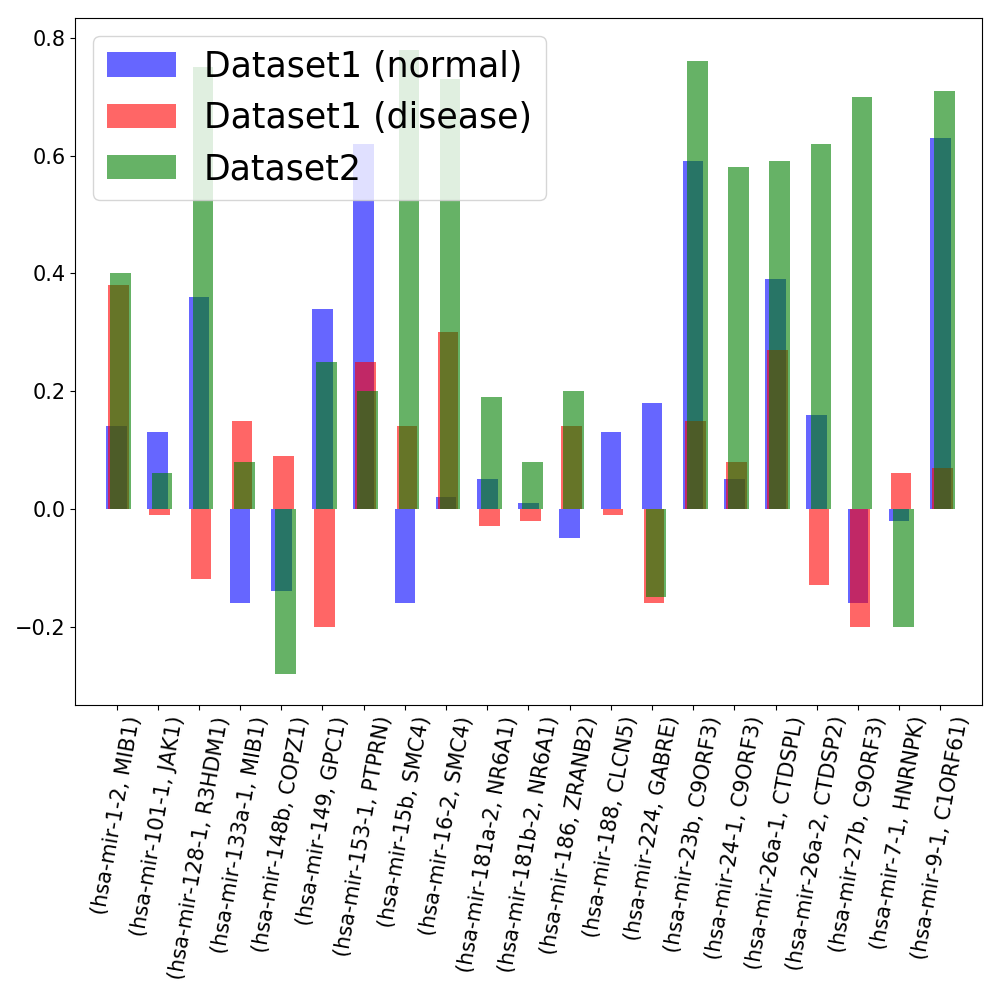
The first dataset we used contained miRNA and mRNA measurements for 18 samples (9 disease samples and 9 normal samples) corresponding to 9 tissues. The miRNA and mRNA expression data were publised by Lu et al. (GSE2564) and Ramaswamy et al. (GSE68928) respectively [15, 16]. This data contains expression profiles corresponding to 164 miRNAs and 10,991 genes and has been frequently used to study miRNA-mRNA co-expression [17-19]. Using this expression data, we were able to identify the expression profiles of 30 intragenic miRNAs of RSmiRT along with the transcripts of their host genes annotated by miRIAD. We calculated the Spearman correlation coefficient between expression profiles of these miRNAs and host genes. One of the possible reasons of low expression correlation might be the consideration of condition specific disease samples. Hence, we did the same analysis procedure independently for the 9 normal and the 9 disease samples. The expression correlation of almost every intragenic miRNA and their host gene pairs got worse in the disease samples than in the normal samples, when we also analyzed the correlation separately for the 9 normal and 9 disease samples (Fig. S2)
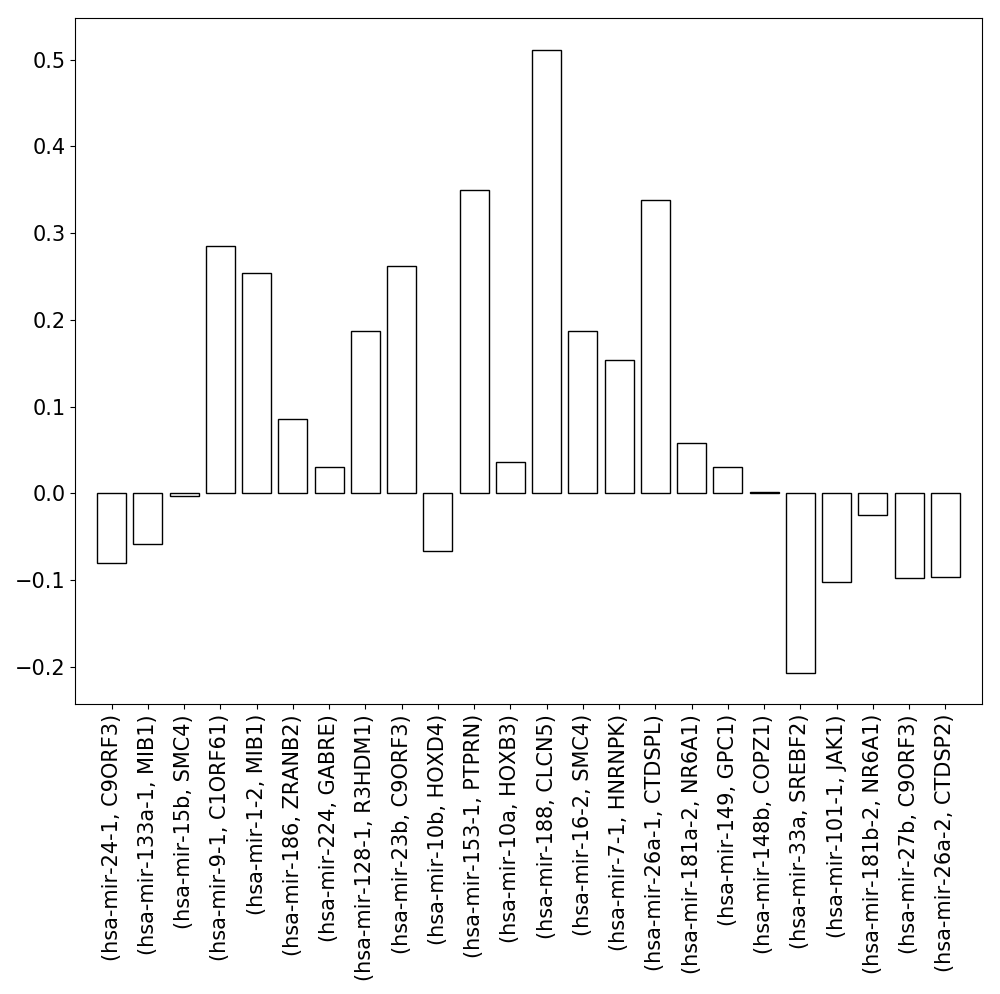
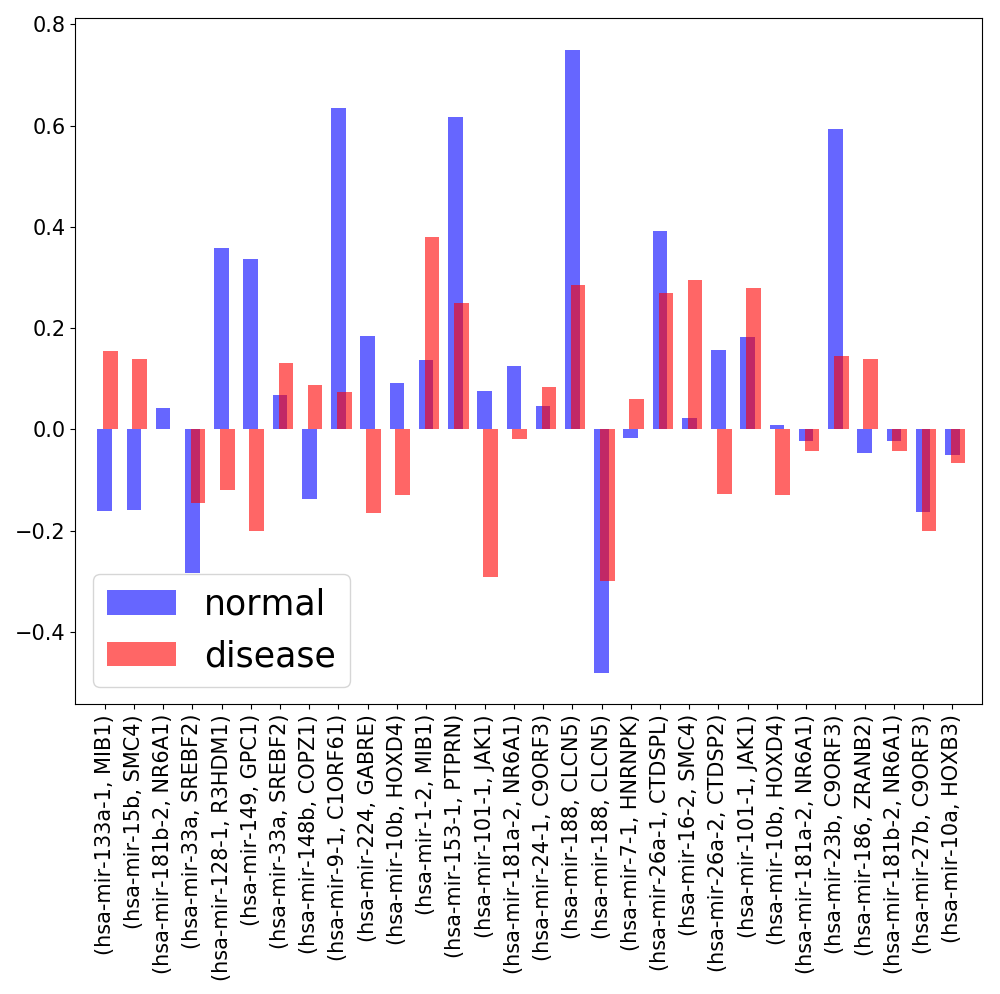
(Left) Expression correlation between the intragenic miRNAs and their host genes. (Right) Change in the expression correlation of miRNA-host gene pairs in normal and disease samples.
3.2 Correlation dataset 2
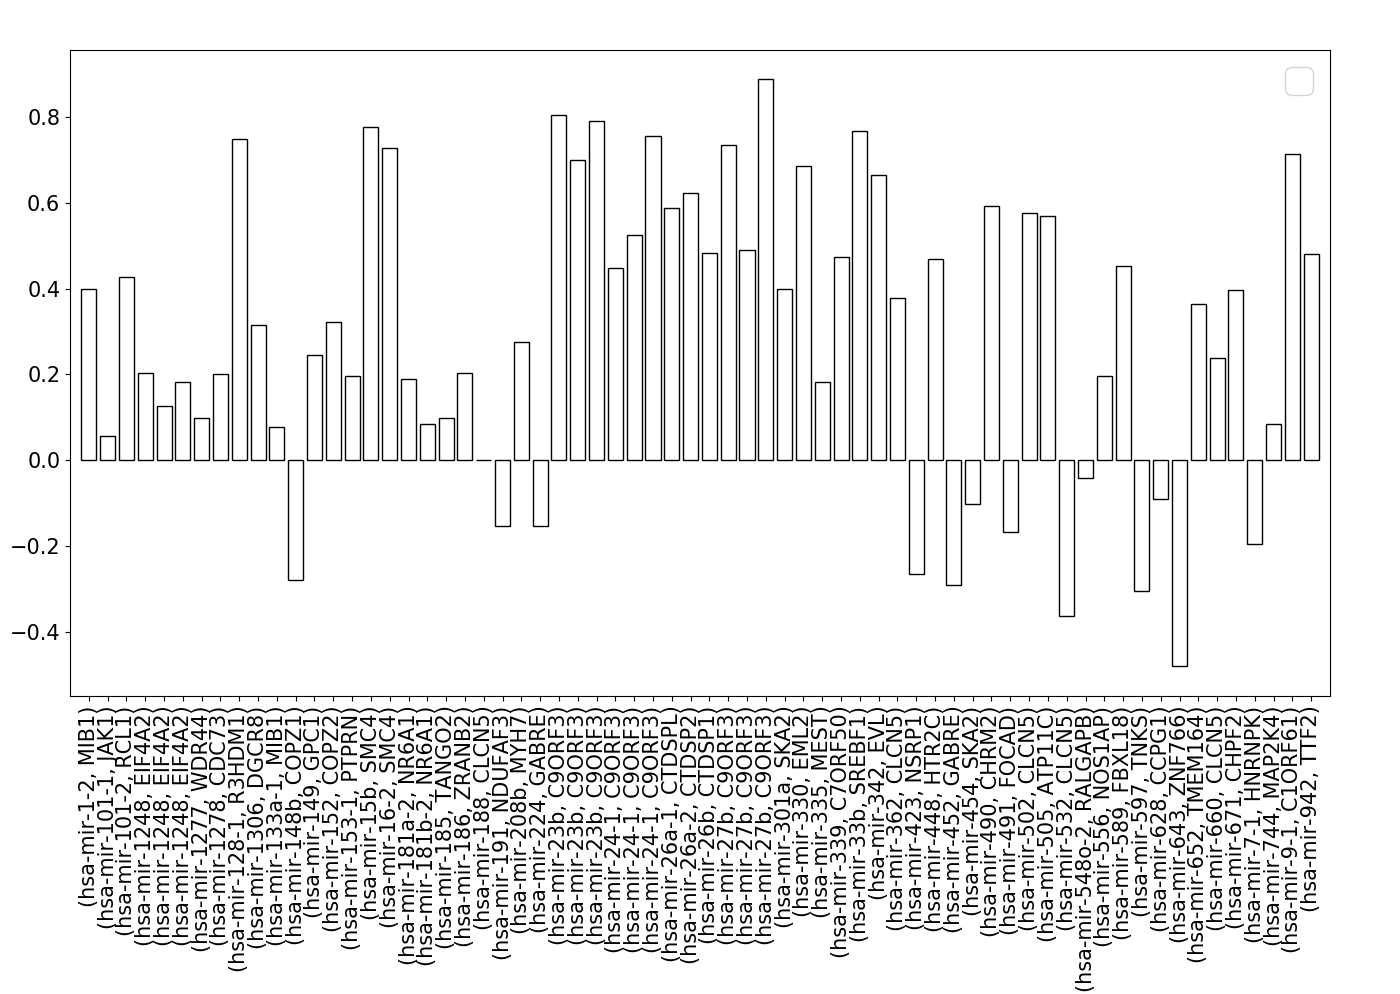
Apart from the expression data from Ramaswamy et al. [15, 16], we did the same expression correlation analysis with the miRNA and mRNA expression data (GSE18069 and GSE22570) in 12 human brain samples used by PROmiRNA [8]. After mapping the 13,042 genes and 590 miRNAs with RSmiRT data, we found the expression data for 66 intragenic miRNAs and their host gene mRNA transcript pairs. ~57% (46 out of 66) of the miRNA-host gene transcript pairs were either positively (>=0.2) or negatively (<=-0.2) correlated (Fig S3).
Expression correlation between the intragenic miRNAs and thei host genes according to a different expression dataset.
3.3 Correlation results combined
By combining the three above mentioned datasets (dataset1 normal, dataset1 disease and dataset2) we found 21 intragenic and host gene transcript pairs with the expression information.
Expression correlation between the intragenic miRNAs and thei host genes according to a different expression dataset.
4. Indication of independent TSSs
Using the expression correlation coefficients from the above datasets, we found some examples of intragenic miRNAs and corresponding host gene transcripts that might transcribed independently.
Expression correlation between the intragenic miRNAs and thei host genes according to a different expression dataset.
5. Disease associations of RSmiRT miRNAs
Using the HMDD disease-miRNA association data, we calculated the percentage of RSmiRT miRNAs associated with different diseases. (Fig. S5)
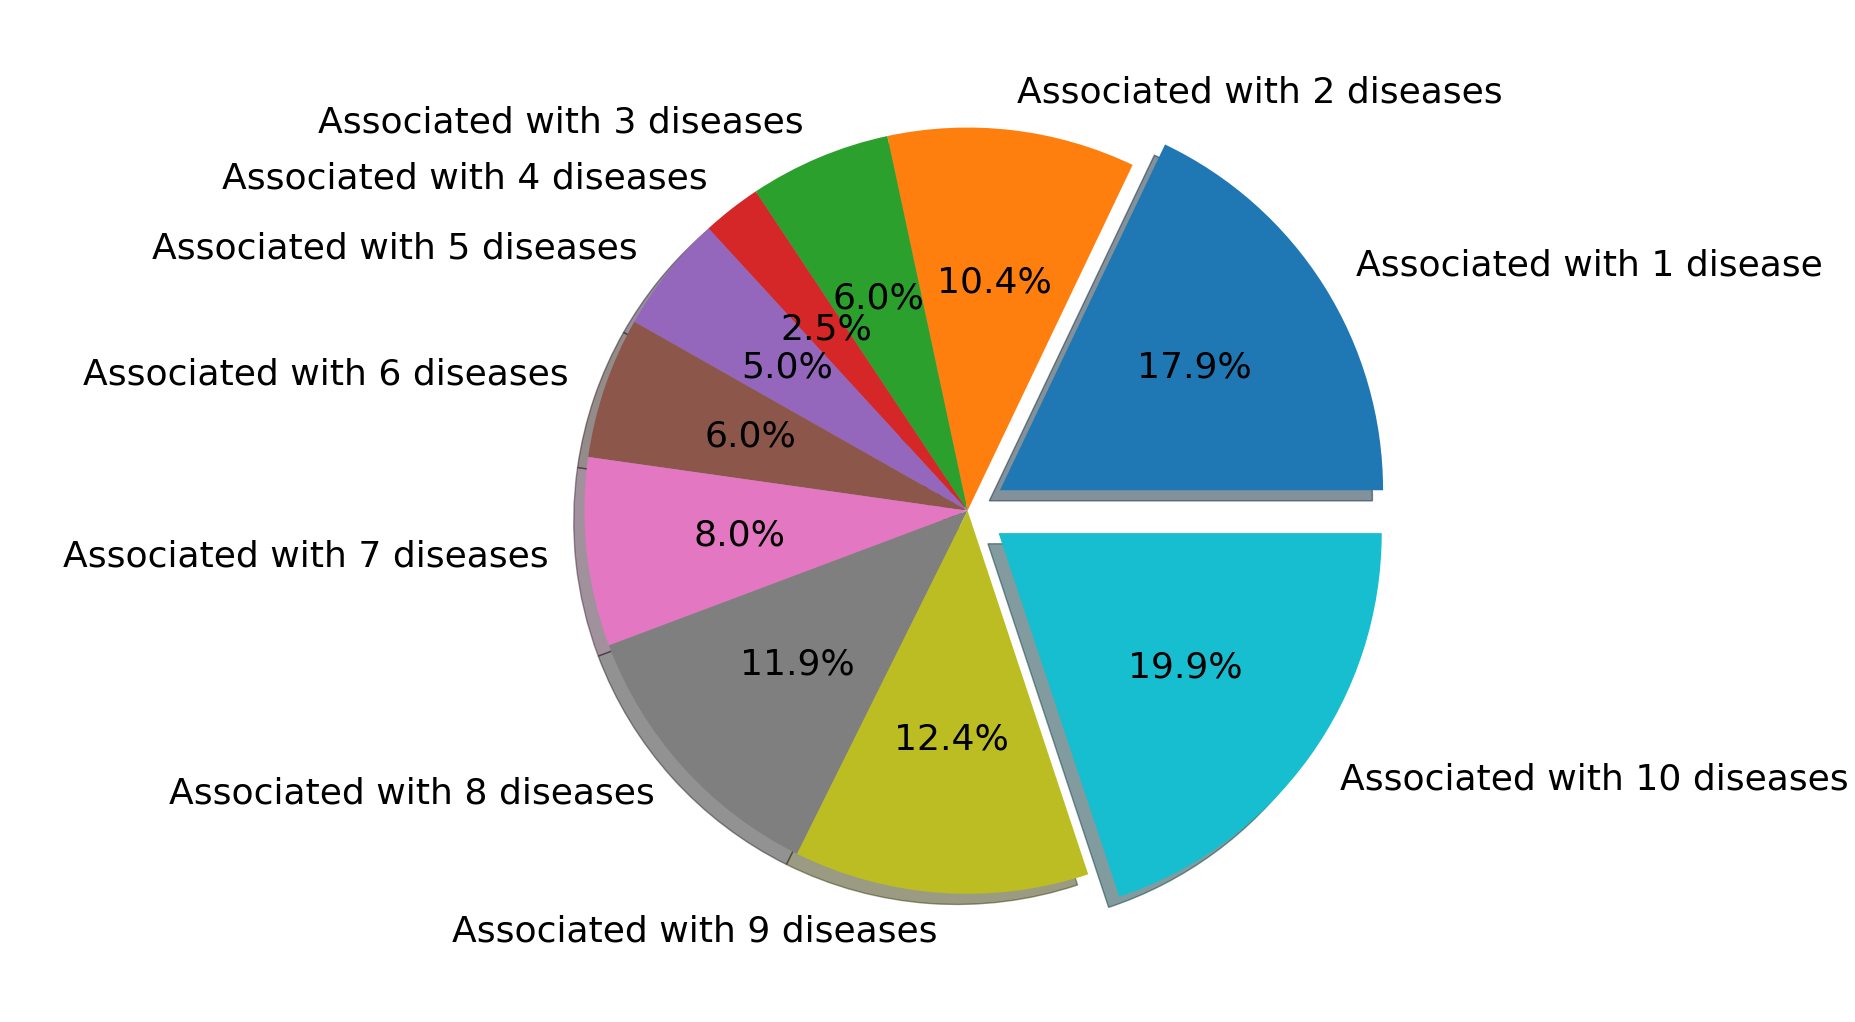
Disease association of RsmiRT miRNAs.
6. Significant TFs around RSmiRT TSSs
Most significant (P <= 0.01) transcription factor motifs found within the 1kb region around the intergenic and intragenic miRNA TSSs and the host gene TSSs of the intragenic miRNAs.