SIOMICS 2.0 Manual
1.Prerequisites
In order to use this software, you should get the following things ready:(1) You need to have python installed (Python 2 or Python 3).
You can download Python from here .
Besides,you need Tkinter (Python 2) or tkinter (Python 3) module to enable the GUI.
For Windows users, the module was already included in the windows Python installer.( link )
For Linux users, please see here for installation instructions.
Besides,you need Tkinter (Python 2) or tkinter (Python 3) module to enable the GUI.
For Windows users, the module was already included in the windows Python installer.( link )
For Linux users, please see here for installation instructions.
(2)You would also have to install Java Runtime Environment.
You can check here for installation instructions.
The software will check the Java version installed. Both Java 6 and Jave 7 Runtime Environment should be OK. But,we recommend to upgrade your java to java 7 to avoid any potential problems.
(3) You may also need to configure the Environment Variable for running java and python
A. For configuring Java Environment Variable, you can see here for instructions.
B. For configuring Python paths, you might see here for help.
2.Paramters
(1) Description of parameters python SIOMICS.py
- -i <input_peak_sequences> Input TF ChIP-seq peak sequences should be in FASTA format, see here.
Note: Please try to avoid including space or other special characters in the path of the input sequence. - -o <ouput> This parameter used to specify the folder for output, all results will be put there.
If the specified output folder (e.g. c:\temp\output) already existed, the predicted results will be put on folder named output_1,output_2,etc (i.e. c:\temp\output_1, c:\temp\output_2, etc) to avoid mixing results for different runs together. - -w <length_of_motifs> This parameter specifies the length of motifs,(Motif length range: 6-14).
- -m <maximal_number_of_output_motifs> The maximal number of motifs to be output.
- -s <support_value_of_motif_combination> The minimal number of sequences a motif module needs to occur in order to be considered as significant or frequent. For example, s =100 means the motifs co-occur at least 100 times to be claimed as frequent. If the instances of motifs in a module co-occur less than 100 times, this module will not be considered.
- -c < corrected_pvalue cutoff> The multiple comparison corrected p-value cutoff for motif module prediction.
- -r < number_of_iterations> The number of iterations.
- -e < 0/1 whether to do extension> 1: Yes, 0:No.
- -t < 0/1 whether to do the motif comparison by using STAMP > 1: Yes, 0: No.
- -y < 0/1 whether to do the visualization by using Cytoscape > 1: Yes, 0: No.
- -j < java_path> This specifies the Path for java,optional.
(2) Recommended parameters for SIOMICS
- -w: 8, motif length =8
- -m: 100, in every iteration,100 top motif candidates will be used to predict motif modules.
- -s: 1% of total number of sequences (Please keep in mind: s should be Integer, for example, the total input sequence 10,000 , s=1%*10,000=100)
- -c: 0.01, corrected p-value cutoff 0.01
- -r: 20, 20 iterations at the maximal.
- -e 1, extenstion is enabled.
- -t 0, STAMP comparison is enabled.
- -y 0, Cytocape is not enabled.
- -j java_path, the path for java, this is optional.
3. Software Usage
The following example shows you how to use the SIOMICS (both command line and GUI).
(1) Command line example
For example, if we want to identify motifs with length=8 from the provided "example_seq" dataset under the "example" directory . We can use the following command:
python SIOMICS.py -i example/example_seq -o example_output -w 8 -s 20 -c 0.01 -r 20 -m 100 -e 1 -t 0 -y 0
The meaning of the above parameters:
Try to identify motifs with length =8, corrected p-value < 0.01. The motifs need to co-occur at least 20 times to be claimed as modules. The maximal number of predicted motifs =100. The maximal iterations =20.
Note:The format of input sequence is the FASTA format.
If you do not want to specify every parameters by yourself, you can use the "batch_siomics.py" scipt we provided. This script can be used to run SIOMICS on a batch of peak sequences with default parameters.
Take the "example" folder included in the software as an example:
We can get the predictions for all datasets under the "example" folder by using the following command:
python batch_siomics.py example
SIOMICS will be run on each of sequence file under "example" folder sequentially.
The output files will be put into directory names as <DatasetName_out>
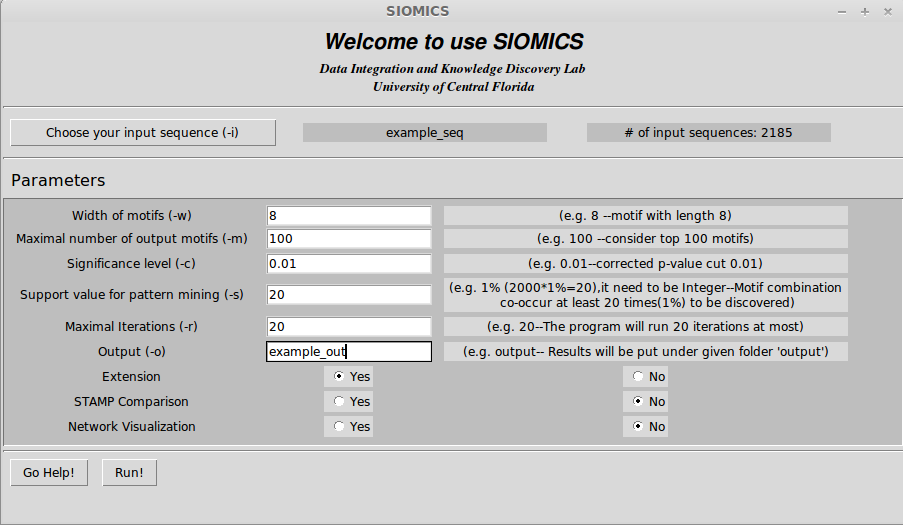
(2) GUI example
In order run GUI version of SIOMICS, just double click "SIOMICS_GUI.py". See the following GUI example:
4. SIOMICS Results
When the software is running, you will see "Running..." shown in the bottom of the GUI.
It might show "Not Responding" when SIOMICS is running on Windows, but it's OK.
It will show "done" on the bottom of GUI once the results were obtained.
SIOMICS will provide 8 files as well as a sub-directory for extension as the results in the output directory provided.SIOMICS Results:
(1) X.motifs
(2) X.mc
(3) X.motifs.JASPAR.pdf
(4) X.motifs.TRANSFAC.pdf
(5) X.mc.sif
(6) X.tfbs
(7) X.motifs.tfbs.inModule
(8) running.log
X.motifs is the result file of the predicted motifs in the format of frequency matrix
X.mc is the result file of motif modules predicted.
X.motifs.JASPAR.pdf is the comparison results between predicted X.motifs with JASPAR V.2010 database.
X.motifs.TRANSFAC.pdf is the comparison results between predicted X.motifs with TRANSFAC V.2010 database.
X.mc.sif is the interaction input for cytoscape, ".sif" format was explained here.
You can use X.mc.sif file to get the interaction network by cytoscape.
The instructions of how to load a simple interaction network (.sif) into cytoscape could be found here
If you are using SIOMICS_GUI version, the interaction network will be loaded into cytoscape by default.
X.tfbs is the TFBSs of the predicted motifs.
X.motifs.tfbs.inModule is the TFBSs of motifs, which were found in modules. For example, motif M0 has 100 TFBSs, but only 50 of TFBSs form motif module instances with the TFBSs of other motifs. We call those TFBSs as TFBSs inModule. The format of X.motifs.tfbs.inModule is the same as X.tfbs.
running.log records the commands and running time for SIOMICS software.
SIOMICS Extension also provided 8 result files with the same format as SIOMICS.
SIOMICS Extension results:
(1) X.motifs.adjusted
(2) X.mc.adjusted
(3) X.motifs.adjusted.JASPAR.pdf
(4) X.motifs.adjusted.TRANSFAC.pdf
(5) X.mc.adjusted.sif
(6) X.tfbs.adjusted
(7) x.motifs.adjusted.tfbs.inModule
(8) running.log
Note: The format of SIOMICS Extension results (1)-(8) is the same as the SIOMICS results (1)-(8)
The following are the examples to describe the format for the result files
See the following example to see the meaning of X.motifs:
			>M0	8.810747221152823	3.359771834161662E-5	8.0935338229
			0.8764 0.0299 0.0518 0.0418
			0.9081 0.0304 0.04 0.0215
			0.8847 0.041 0.0416 0.0327
			0.8378 0.064 0.0532 0.045
			0.839 0.0654 0.0515 0.0441
			0.8756 0.0456 0.0423 0.0365
			0.9033 0.0333 0.0349 0.0286
			0.8752 0.0337 0.0463 0.0449
The first line represents:
ID of motifs : M0
Scan_cutoff: 8.810747221152823 Used to define a putative TFBS of the motif.
lambda: 3.359771834161662E-5 Represent the probability of this motif occurring in random sequences (per nucleotide position).
MDScan_score: 8.0935338229 MDScan score used to represent the statistical significance of predicted motifs
The remaining lines represent the frequencies of"A,C,G,T" in each position.
See the following example to see the meaning of X.mc:
M66 M21 (58) (6.7476668697e-10)This denotes M66 and M21 were regarded as a motif module (co-occur in 58 sequences). The corrected pvalue is 6.7476668697e-10.
An example for X.motifs.JASPAR.pdf and X.motifs.TRANSFAC
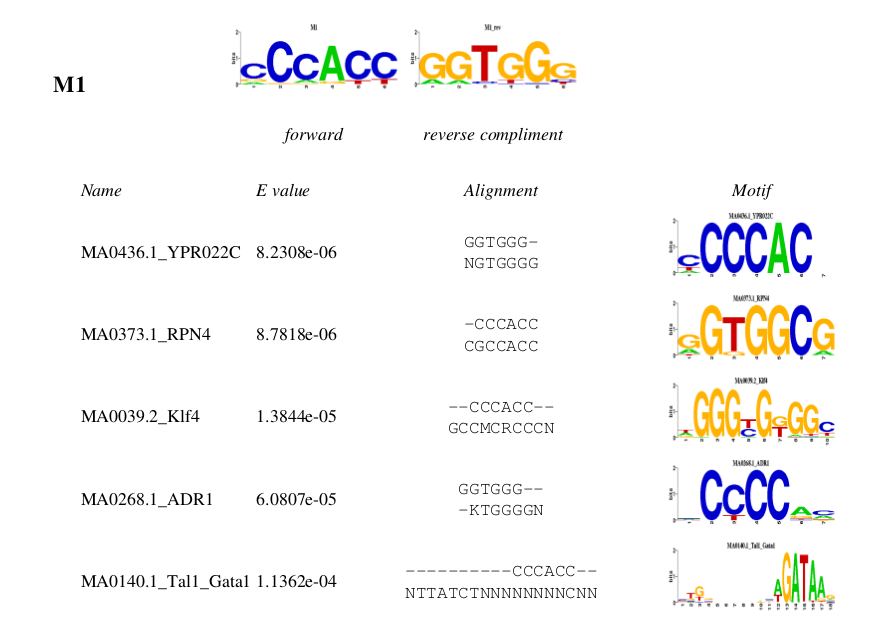 Note: The above comparison between predicted motifs and known motifs in TRANSFAC and JASPAR were using STAMP with the default parameters.
One can compare the predicted motifs with motifs from other sources with different parameters with STAMP. One can simply use the
predicted motifs as the "Input Motifs" to STAMP, and then choose the source of the specified motifs and parameters.
For details about how to use STAMP, please refer to the help.
Note: The above comparison between predicted motifs and known motifs in TRANSFAC and JASPAR were using STAMP with the default parameters.
One can compare the predicted motifs with motifs from other sources with different parameters with STAMP. One can simply use the
predicted motifs as the "Input Motifs" to STAMP, and then choose the source of the specified motifs and parameters.
For details about how to use STAMP, please refer to the help. An example for X.mc.sif
				M1 pp M2
				M13 pp M12
				M13 pp M10
				M2 pp M1
				M7 pp M9
				M13 pp M2
				M7 pp M6
				M7 pp M5
				M7 pp M8
				M7 pp M3
pp means protein-protein interaction (M1= TF corresponds to motif M1, M2=TF corresponds to motif M2)
By using cytoscape, we will have the following interaction network:
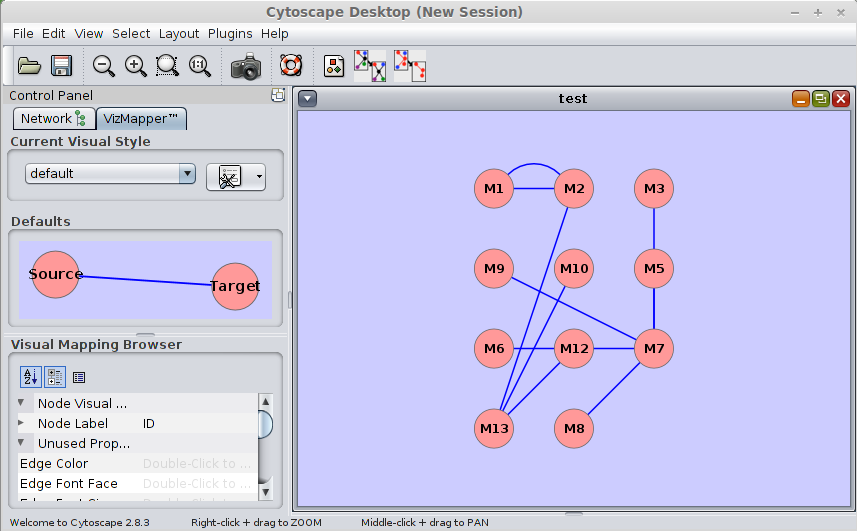
Note: The cytoscape software will be automatically launched after the prediction was finished. If one does not want to launch the cytoscape, one can use the command line version or the "batch_siomics.py" to obtain the predictions only. After that, one may use the ".sif" file generated to visualize the interaction network with cytoscape. The details about how to use cytoscape are here .
See the following example for X.tfbs
>M0:
M0,mm8_ct_UserTrack_3545_MACS_peak_19 range=chr1:13112912-13113786 5'pad=0 3'pad=0 strand=+ repeatMasking=N,609	GGGGGGGG
M0,mm8_ct_UserTrack_3545_MACS_peak_20 range=chr1:13645559-13646424 5'pad=0 3'pad=0 strand=+ repeatMasking=N,305	GGGTGGGG
M0,mm8_ct_UserTrack_3545_MACS_peak_32 range=chr1:36005234-36006169 5'pad=0 3'pad=0 strand=+ repeatMasking=N,42	GGGTGGGG
M0,mm8_ct_UserTrack_3545_MACS_peak_47 range=chr1:52897802-52898706 5'pad=0 3'pad=0 strand=+ repeatMasking=N,544	GGGGGGGG
M0,mm8_ct_UserTrack_3545_MACS_peak_72 range=chr1:72161911-72162847 5'pad=0 3'pad=0 strand=+ repeatMasking=N,356	GGGTGGGG
M0,mm8_ct_UserTrack_3545_MACS_peak_77 range=chr1:77336476-77337340 5'pad=0 3'pad=0 strand=+ repeatMasking=N,704	GGGTGGGG
This is the TFBSs information for predicted motif M0. Let's explain its format by using the first line:
M0,mm8_ct_UserTrack_3545_MACS_peak_19 range=chr1:13112912-13113786 5'pad=0 3'pad=0 strand=+ repeatMasking=N,609 GGGGGGGGThe above result represents M0 has a instance in peak (chr1:13112912-13113786,strand=+). The relative position of the instance is starting from 609 and the instance is GGGGGGGG.
The following is an example for running.log
Command using:
python SIOMICS.py
-i /home/jding/projects/SIOMICS_Aug/SIOMICS_Server_09_23/download/Software/SIOMICS_Linux/example/example_seq
-w 8
-m 100
-s 20
-c 0.01
-r 5
-o output
Running started from: 2013-09-29 19:58:48.735797
Running finished at: 2013-09-29 20:55:21.277166
You can retrieve the command you have used and time cost of the software from this running.log file
5. Contact Info
If you have any question regarding to the SIOMICS software or you have found any bugs, please feel free to contact
us via xiaoman@mail.ucf.edu. For any non-academic use of this software, please also contact xiaoman@mail.ucf.edu.